There is a great deal of evidence showing that shot metrics, specifically unblocked shot attempts and all shot attempts, are predictive at a team and individual player level in regards to future goals scored. This is a great metric to analyze a team overall, but what do these statistics really tell us about the individual player? In reality, not much. Yes, they tell us that certain players appear to “drive possession” for their teams, but they do not show us why or how.
Based on the limited statistics currently available outside of tracking individual games I did some work in trying to identify a subset of individual based statistics to attempt to give a reasonably reliable metric to tell us which players created the most shot attempts for their teams, thus leading to goals for. Taking into account a players role is essential as well as usage does have an affect on all their individual statistics whether a player is asked to fulfill an offensive or defensive role.
In doing a correlation study of various statistics and how they relate to goals I found a combination of stats that are valuable indicators of overall shot attempts while on the ice at the team level. I used data from WAR-on-Ice.com and will include their statistic abbreviations here. They are giveaways (GV), takeaways (TK), penalties drawn (PN-) and personal unblocked shot shooting percentage (PFenSh%).
Each of these statistics requires a player to have possession of the puck. They all speak to the skill of the player, the more skilled the player generally that means more time with the puck on their stick.
As opposed to tracking the positive result of possession being a shot attempt, we are attempting to track the events that cause shot attempts. Giveaways are in general a less desired statistic, however it does show which players have the puck on their stick most often. Takeaways show which players can gain possession for their team and penalties drawn will generally require the player to have possession of the puck as well. The unblocked shot attempt shooting percentage simply adds an element of how skilled the player is at scoring for their team.
I used all data from the 2007-2008 NHL season to present day at five-on-five score adjusted rates for this study. Based on the combination of these statistics there is a 79% correlation to goals for on ice and over a 78% correlation to scoring chances, all shot attempts and unblocked shot attempts for. That is less than the 93% minimum correlation that goals for has with scoring chances, all shot attempts and unblocked shot attempts for. However these statistics can give us better insight into which players are contributing to a team’s possession and goal scoring rates to a greater degree.
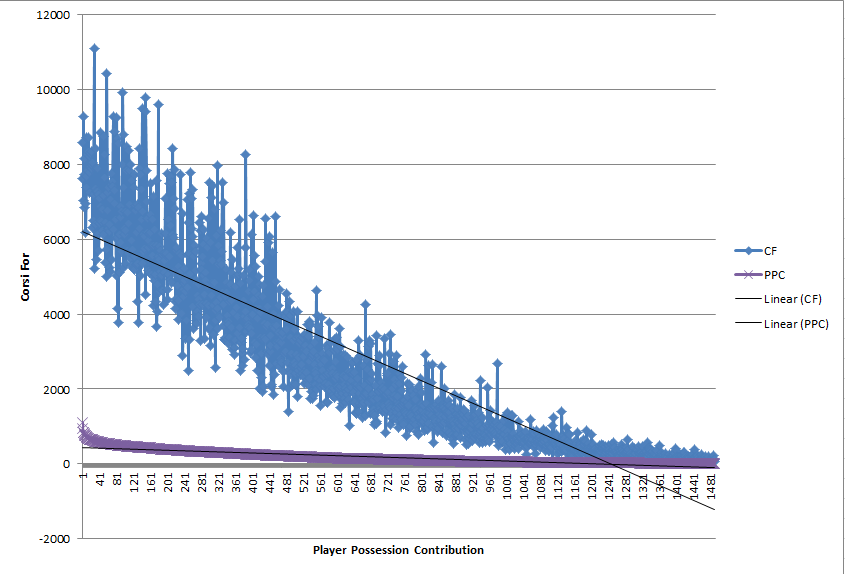
This chart shows the relationship between Player Possession Contribution and Corsi For. Clearly as Corsi decreases so does PPC.
So which players were the highest rated since 2007-2008 in regards to what I will call at this point Player Possession Contribution (PPC)? I will break this down using the top five PPC ratings for forwards and defenders separately.
Forwards (Best Season)
1. Pavel Datsyuk, Detroit Red Wings, 2007-2008 (7.0 Sh%, 45 GV, 103 TK, 34 PN-)
2. Pavel Datsyuk, Detroit Red Wings, 2009-2010 (9.2 Sh%, 50 GV, 105 TK, 24 PN-)
3. Joe Thornton, San Jose Sharks, 2011-2012 (8.2 Sh%, 76 GV, 77 TK, 22 PN-)
4. Joe Thornton, San Jose Sharks, 2010-2011 (6.3 Sh%, 76 GV, 87TK, 13 PN-)
5. John Tavares, New York Islanders, 2011-2012 (7.2 Sh%, 50 GV, 84 TK, 31 PN-)
Defenders (Best Season)
1. Erik Karlsson, Ottawa Senators, 2013-2014 (5.0 Sh%, 89 GV, 57 TK, 13 PN-)
2. Erik Karlsson, Ottawa Senators, 2011-2012 (6.5 Sh%, 63 GV, 59 TK, 12 PN-)
3. Mike Green, Washington Capitals, 2007-2008 (3.3 Sh%, 67 GV, 41 TK, 24 PN-)
4. Erik Karlsson, Ottawa Senators, 2014-2015 (6.2 Sh%, 70 GV, 40 TK, 11 PN-)
5. T.J. Brodie, Calgary Flames, 2014-2015 (3.5 Sh%, 65 GV, 46 TK, 12 PN-)
So those were the best Player Possession Contribution (PPC) seasons since 20072008 but which players have been the best overall? Once again we will break down this list into the top five forwards and defenders.
Forwards (Best Overall)
1. Joe Thornton, San Jose Sharks, 602 games (8.3 Sh%, 509 GV, 461 TK, 127 PN-)
2. Pavel Datsyuk, Detroit Red Wings, 516 games (7.8 Sh%, 243 GV, 555 TK, 139 PN-)
3. Alex Ovechkin, Washington Capitals, 586 games (6.9 Sh%, 372 GV, 275 TK, 193 PN-)
4. Evgeni Malkin, Pittsburgh Penguins, 502 games (9.0 Sh%, 287 GV, 318 TK, 208 PN-)
5. Martin St. Louis, New York Rangers/Tampa Bay Lightning, 601 games (8.5 Sh%, 292 GV, 366 TK, 151 PN-)
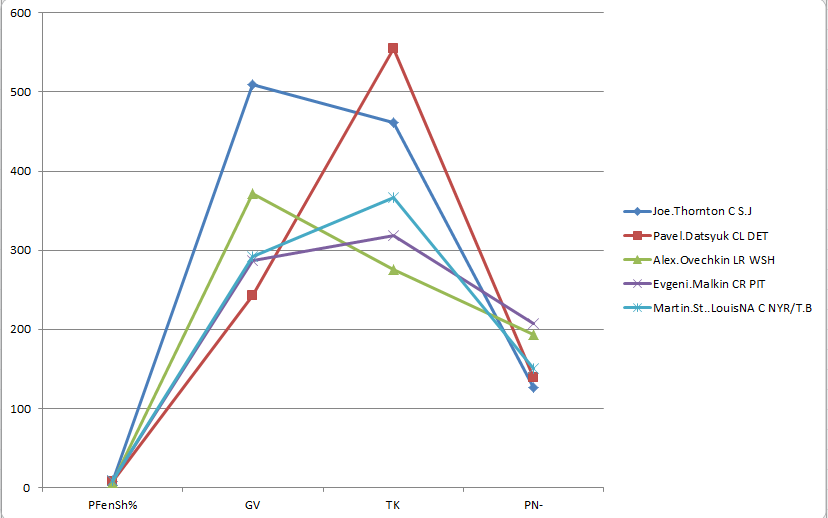
Best overall forwards since the 20072008 NHL season.
Defenders (Best Overall)
1. Dustin Byfuglien, Winnipeg Jets, Chicago Blackhawks, 558 games (4.4 Sh%, 275 GV, 305 TK, 64 PN-)
2. Mike Green, Washington Capitals, 473 games (4.0 Sh%, 368 GV, 181 TK, 91 PN-)
3. Erik Karlsson, Ottawa Senators, 385 games (5.2 Sh%, 327 GV, 239 TK, 59 PN-)
4. Duncan Keith, Chicago Blackhawks, 593 games (2.8 Sh%, 325 GV, 254 TK, 27 PN-)
5. Dan Hamhuis, Vancouver Canucks/Nashville Predators, 562 games (2.1 Sh%, 285 GV, 232 Tk, 76 PN-)
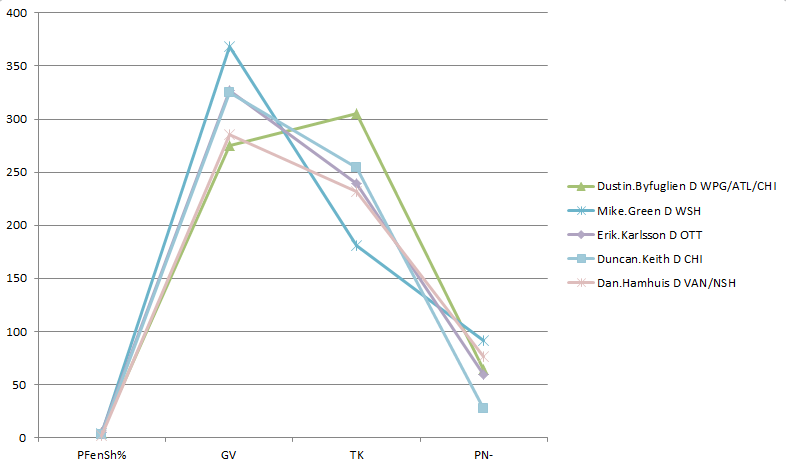
Best overall defenders since the 20072008 NHL season.